Spaces Debug Menu
Debug Menu
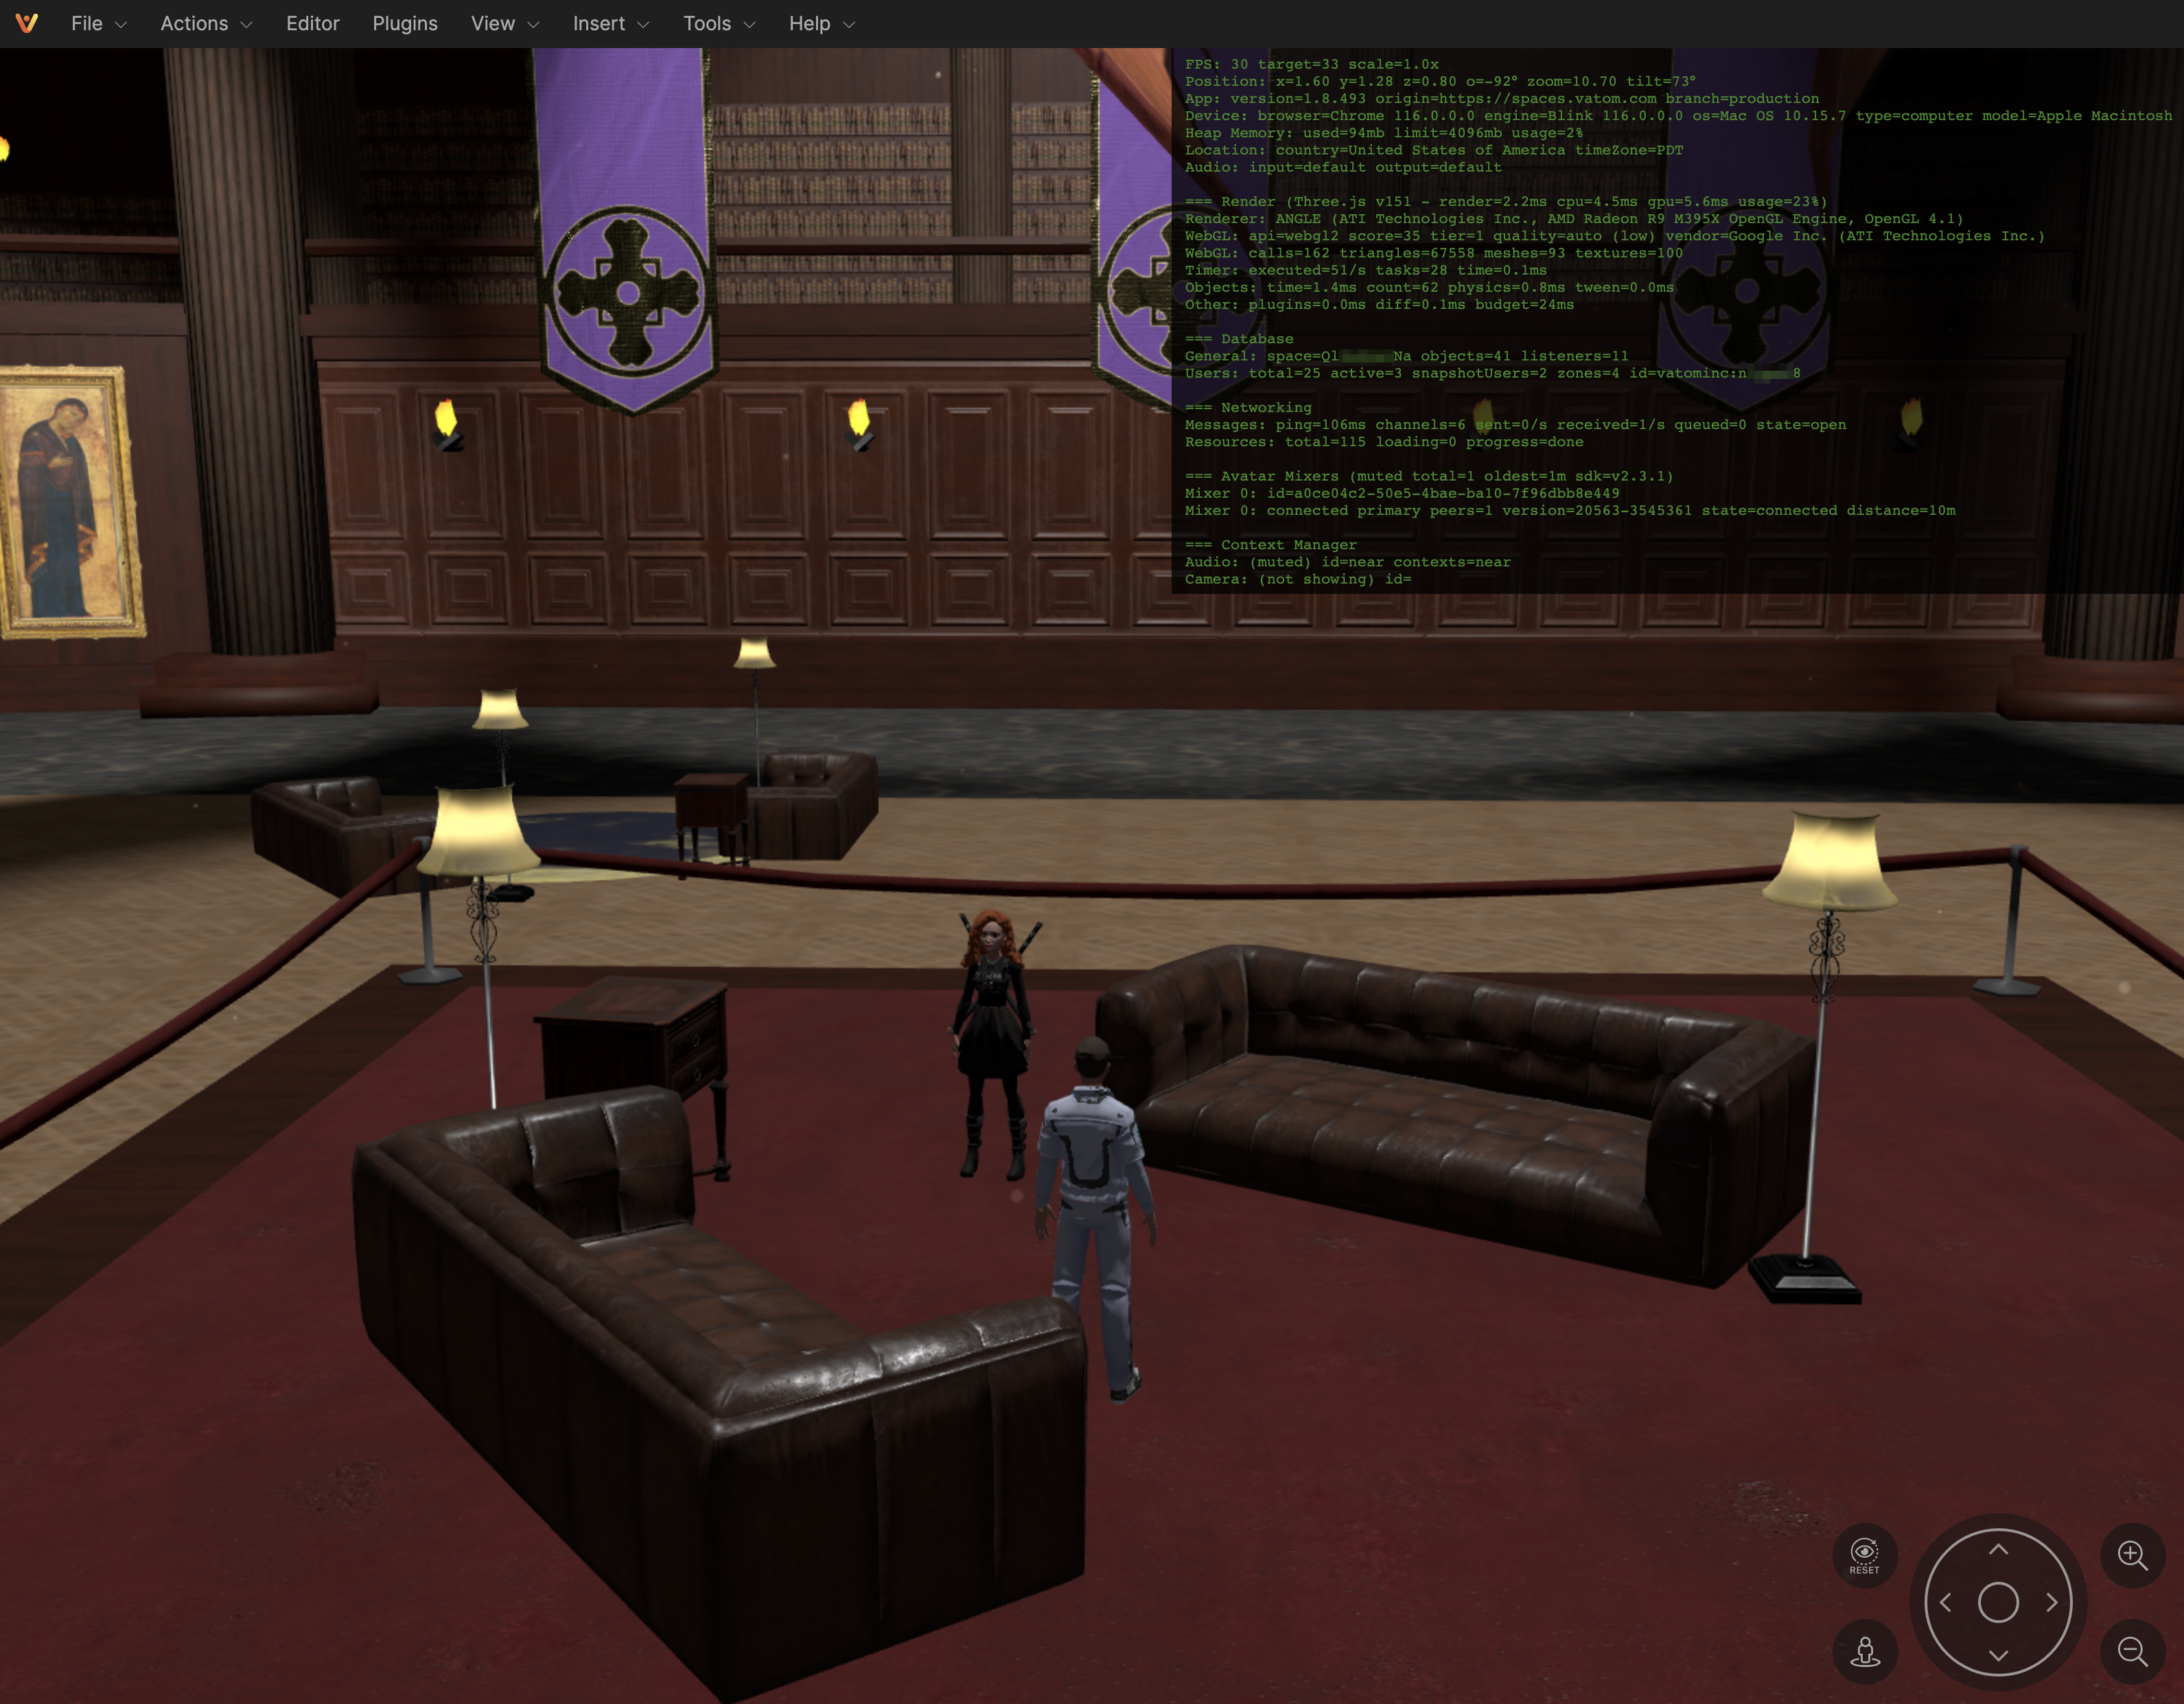
In order to gather more technical information about your experience and to aid technical support, you can use the Debug Menu to view and capture detailed analytics about your own or your guest's performance, device, network, and connections as you move around the space.
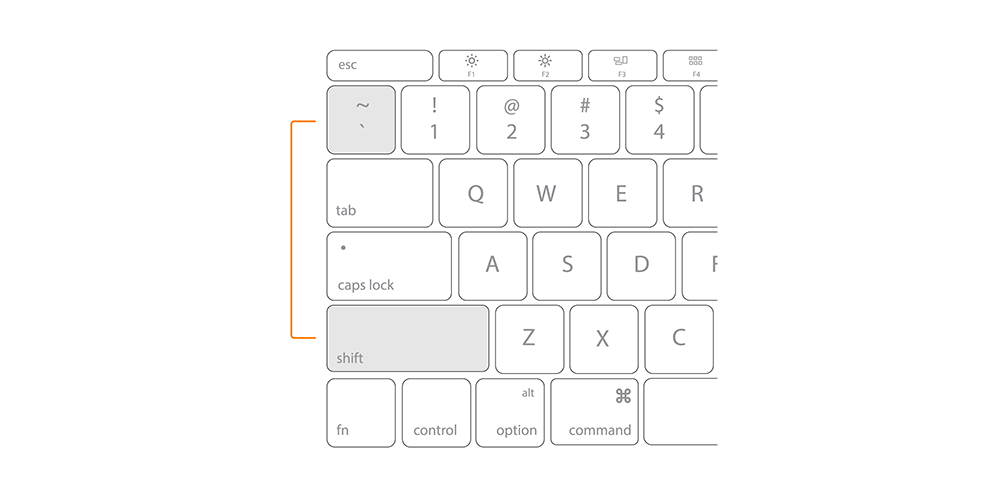
To open the debug menu for yourself, press Shift + ~ (shift + tilde). This displays information about you and your connection.
When submitting reports for bugs and technical issues, please include screenshots or screen recordings including the Vatom Debug Menu and the Google Chrome Dev Tools > Console Log.
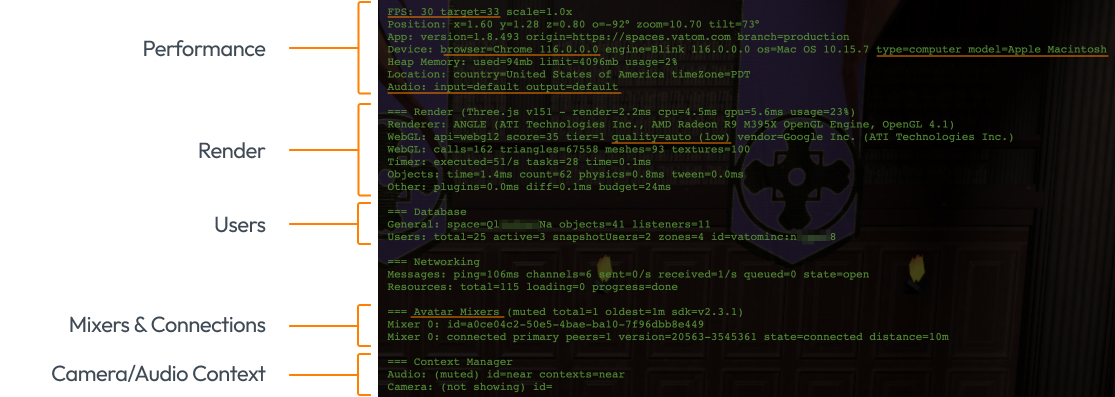
Debug Information
Performance - Displays the user's current FPS (Frames Per Second), Position in Space, Device Type. FPS is the ultimate indicator of "performance" within the space, and users with a low FPS (< 20fps) will be having a poor experience. See additional tips to increase performance.
Render - Displays information about the scene rendering and graphics quality. Spaces automatically adjusts "render quality" based on the capabilites of the system, in order to provide a comfortable experience for all guests.
Users - Notes the space limits and user count within the space, nearby, and in zones.
Mixers & Connections - If a guest cannot hear others, check that they are standing nearby, and have made connections within the mixers.
Camera/Audio Context - Check if presenters have their audio set to near (local audio), zone (presentation audio), or everywhere (broadcast).
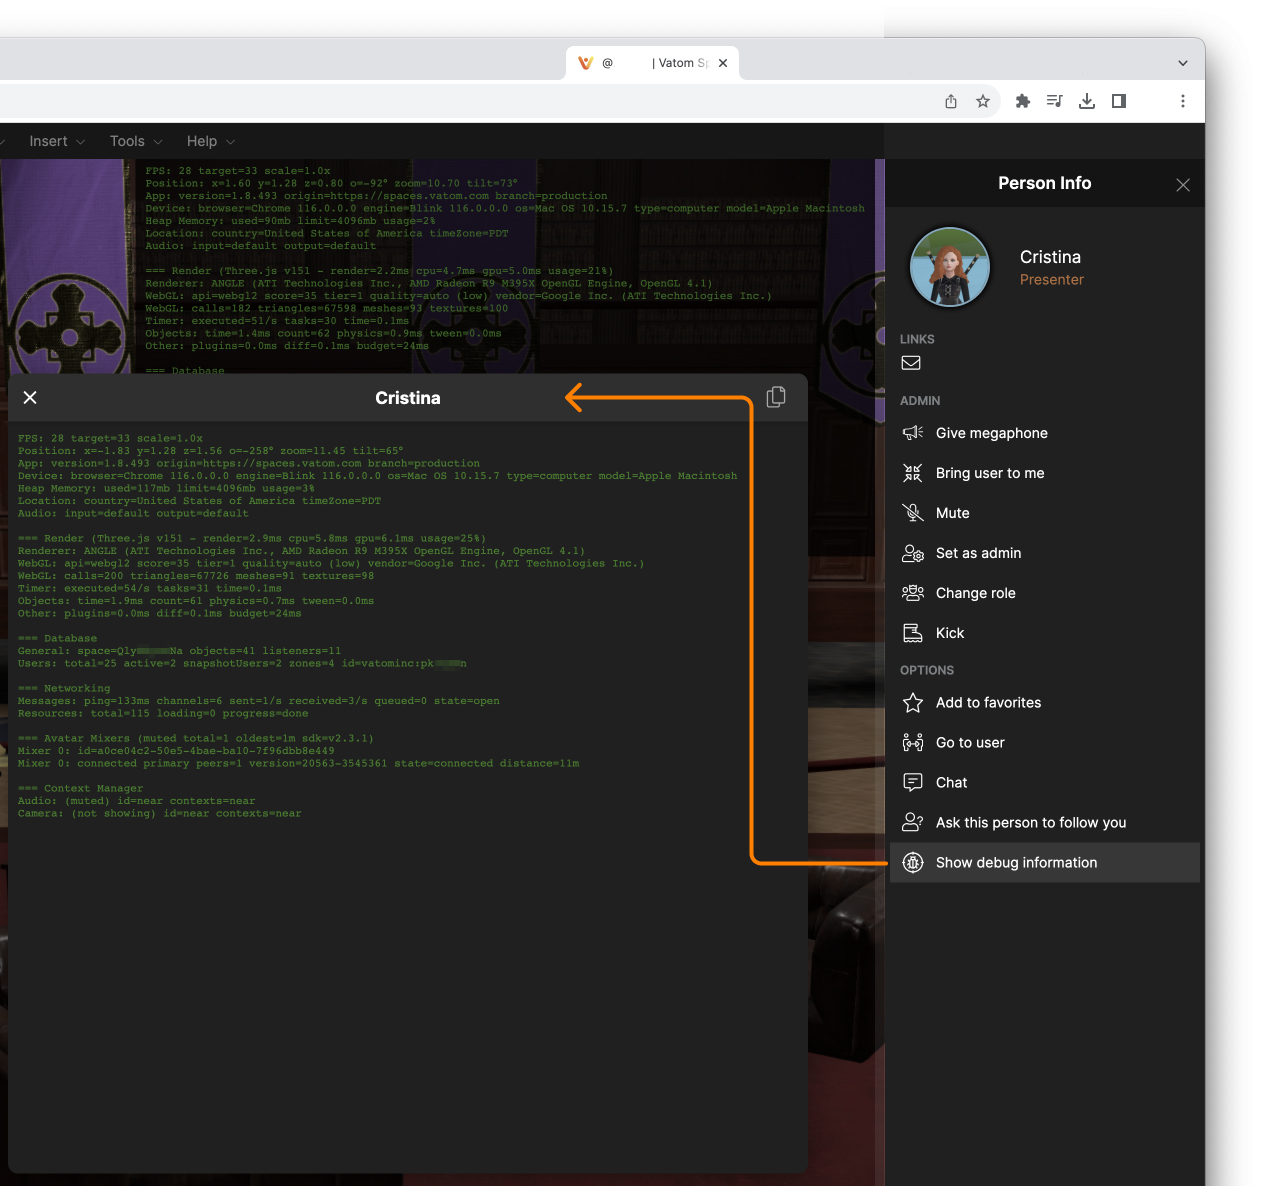
Guest Debug
Once your debug menu is open (Shift + ~) you can click on any user and now have the option to "Show Debug Information" in their User Options. This shows the debug menu for that user, which can help troubleshoot network and connection issues.